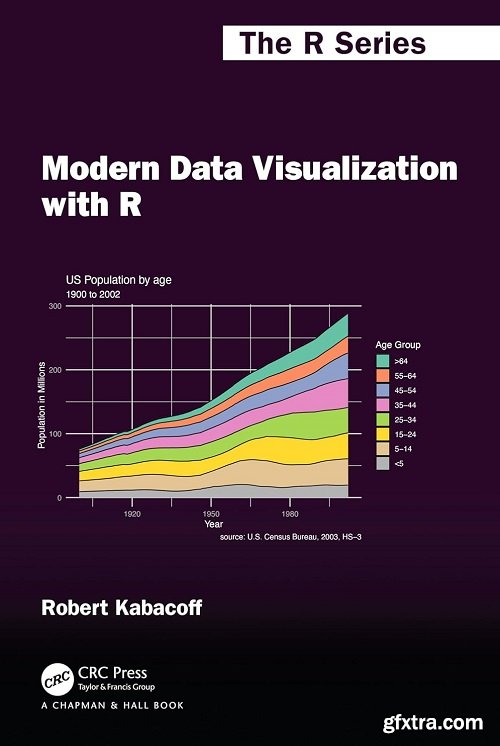
Modern Data Visualization with R
by Robert Kabacoff
English | 2024 | ISBN: 1032287608 | 272 pages | True PDF | 41.69 MB
Modern Data Visualization with R describes the many ways that raw and summary data can be turned into visualizations that convey meaningful insights. It starts with basic graphs such as bar charts, scatter plots, and line charts, but progresses to less well-known visualizations such as tree maps, alluvial plots, radar charts, mosaic plots, effects plots, correlation plots, biplots, and the mapping of geographic data. Both static and interactive graphics are described and the use of color, shape, shading, grouping, annotation, and animations are covered in detail. The book moves from a default look and feel for graphs, to graphs with customized colors, fonts, legends, annotations, and organizational themes.
Features
• Contains a wide breadth of graph types including newer and less well-known approaches
• Connects each graph type to the characteristics of the data and the goals of the analysis
• Moves the reader from simple graphs describing one variable to building visualizations that describe complex relationships among many variables
• Provides newer approaches to creating interactive web graphics via javascript libraries
• Details how to customize each graph type to meet users’ needs and those of their audiences
• Gives methods for creating visualizations that are publication ready for print (in color or black and white) and the web
• Suggests best practices
• Offers examples from a wide variety of fields
The book is written for those new to data analysis as well as the seasoned data scientist. It can be used for both teaching and research, and will particularly appeal to anyone who needs to describe data visually and wants to find and emulate the most appropriate method quickly. The reader should have some basic coding experience, but expertise in R is not required. Some of the later chapters (e.g., visualizing statistical models) assume exposure to statistical inference at the level of analysis of variance and regression.
TO MAC USERS: If RAR password doesn't work, use this archive program:
RAR Expander 0.8.5 Beta 4 and extract password protected files without error.
TO WIN USERS: If RAR password doesn't work, use this archive program:
Latest Winrar and extract password protected files without error.


